Me Or Them app icon

Free & Open Source  ·  macOS  ·  v2.63.0

Is it you,
or is it them?

A network intelligence monitor that lives in your Mac's menubar and answers the question every remote worker, gamer, and developer asks a dozen times a day — and tells you exactly why.

Download Free v2.63.0 View Source

macOS 14 Sonoma or later  ·  Apple Silicon & Intel  ·  No account required

All good
Unstable
Critical
Paused

For everyone

A circle in your menubar. Green means everything is fine.

Install Me Or Them and watch the icon. You never need to touch a setting, read a metric, or open a window. It does its job silently, invisibly, all day long — and the moment something goes wrong, you'll know in seconds. That's it. That's the app.

Under the surface

Seventeen diagnostic algorithms running around the clock.

Every two seconds: ICMP pings to multiple targets, raw UDP probes to eight DNS resolvers, gateway fault isolation, WiFi signal analysis, hardware error counters, MTU path probing, and an adaptive polling engine that doubles resolution when anything degrades. All at 0.4% CPU.

Built for anyone whose work or play depends on a reliable connection

🧑‍💻

Remote Workers

When the video call is choppy, know in seconds whether the problem is your router, your ISP, or entirely on their side — and stop rebooting things that don't need rebooting.

🎮

Gamers

Spot the latency spike that caused that death. See whether it was your local network or the game server, with fault isolation built in at every single poll tick.

🎙️

Streamers & Podcasters

Catch jitter and packet loss before they ruin a recording. Real-time insight without interrupting your flow — a glance at your menubar is all it takes.

🛠️

Developers & SREs

Export a year of history as CSV, JSON, or PDF. Correlate network degradation with your incident timeline. Query the local SQLite database directly. Probe DNS resolvers with raw UDP.

Features

Professional-grade monitoring.
Consumer-grade simplicity.

Me Or Them watches every dimension of your network simultaneously — latency, loss, jitter, DNS, WiFi, bandwidth, and hardware health — and surfaces exactly what matters, when it matters.

📡

Real-Time Latency, Loss & Jitter

ICMP pings or HTTP/HTTPS probes to multiple custom targets every 2–30 seconds. Each metric is averaged over its own configurable evaluation window before any status change fires — so AWDL scans, band-steering events, and momentary blips are absorbed. You get signal, not noise.

🗺️

Fault Isolation — Me or Them?

Every tick includes a gateway ping alongside your external targets. Me Or Them immediately tells you: local network / router, ISP / internet outage, or mixed. The gateway has its own live entry in the dropdown — never buried three levels deep.

📶

Deep WiFi Diagnostics

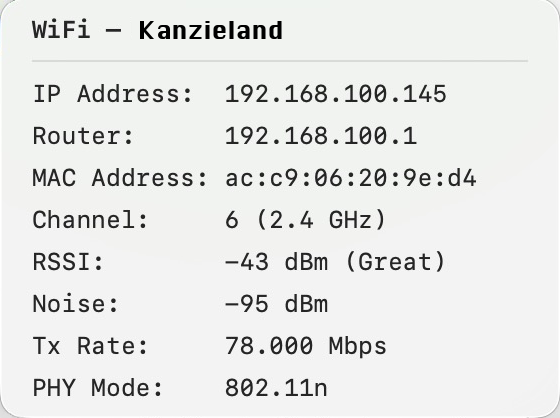
BSSID, RSSI, SNR, channel, band, PHY mode, Tx rate, IP address, and router — all without requesting Location permissions, sourced directly from CoreWLAN. On Ethernet, it shows your IP, MAC address, and interface details instead.

🌐

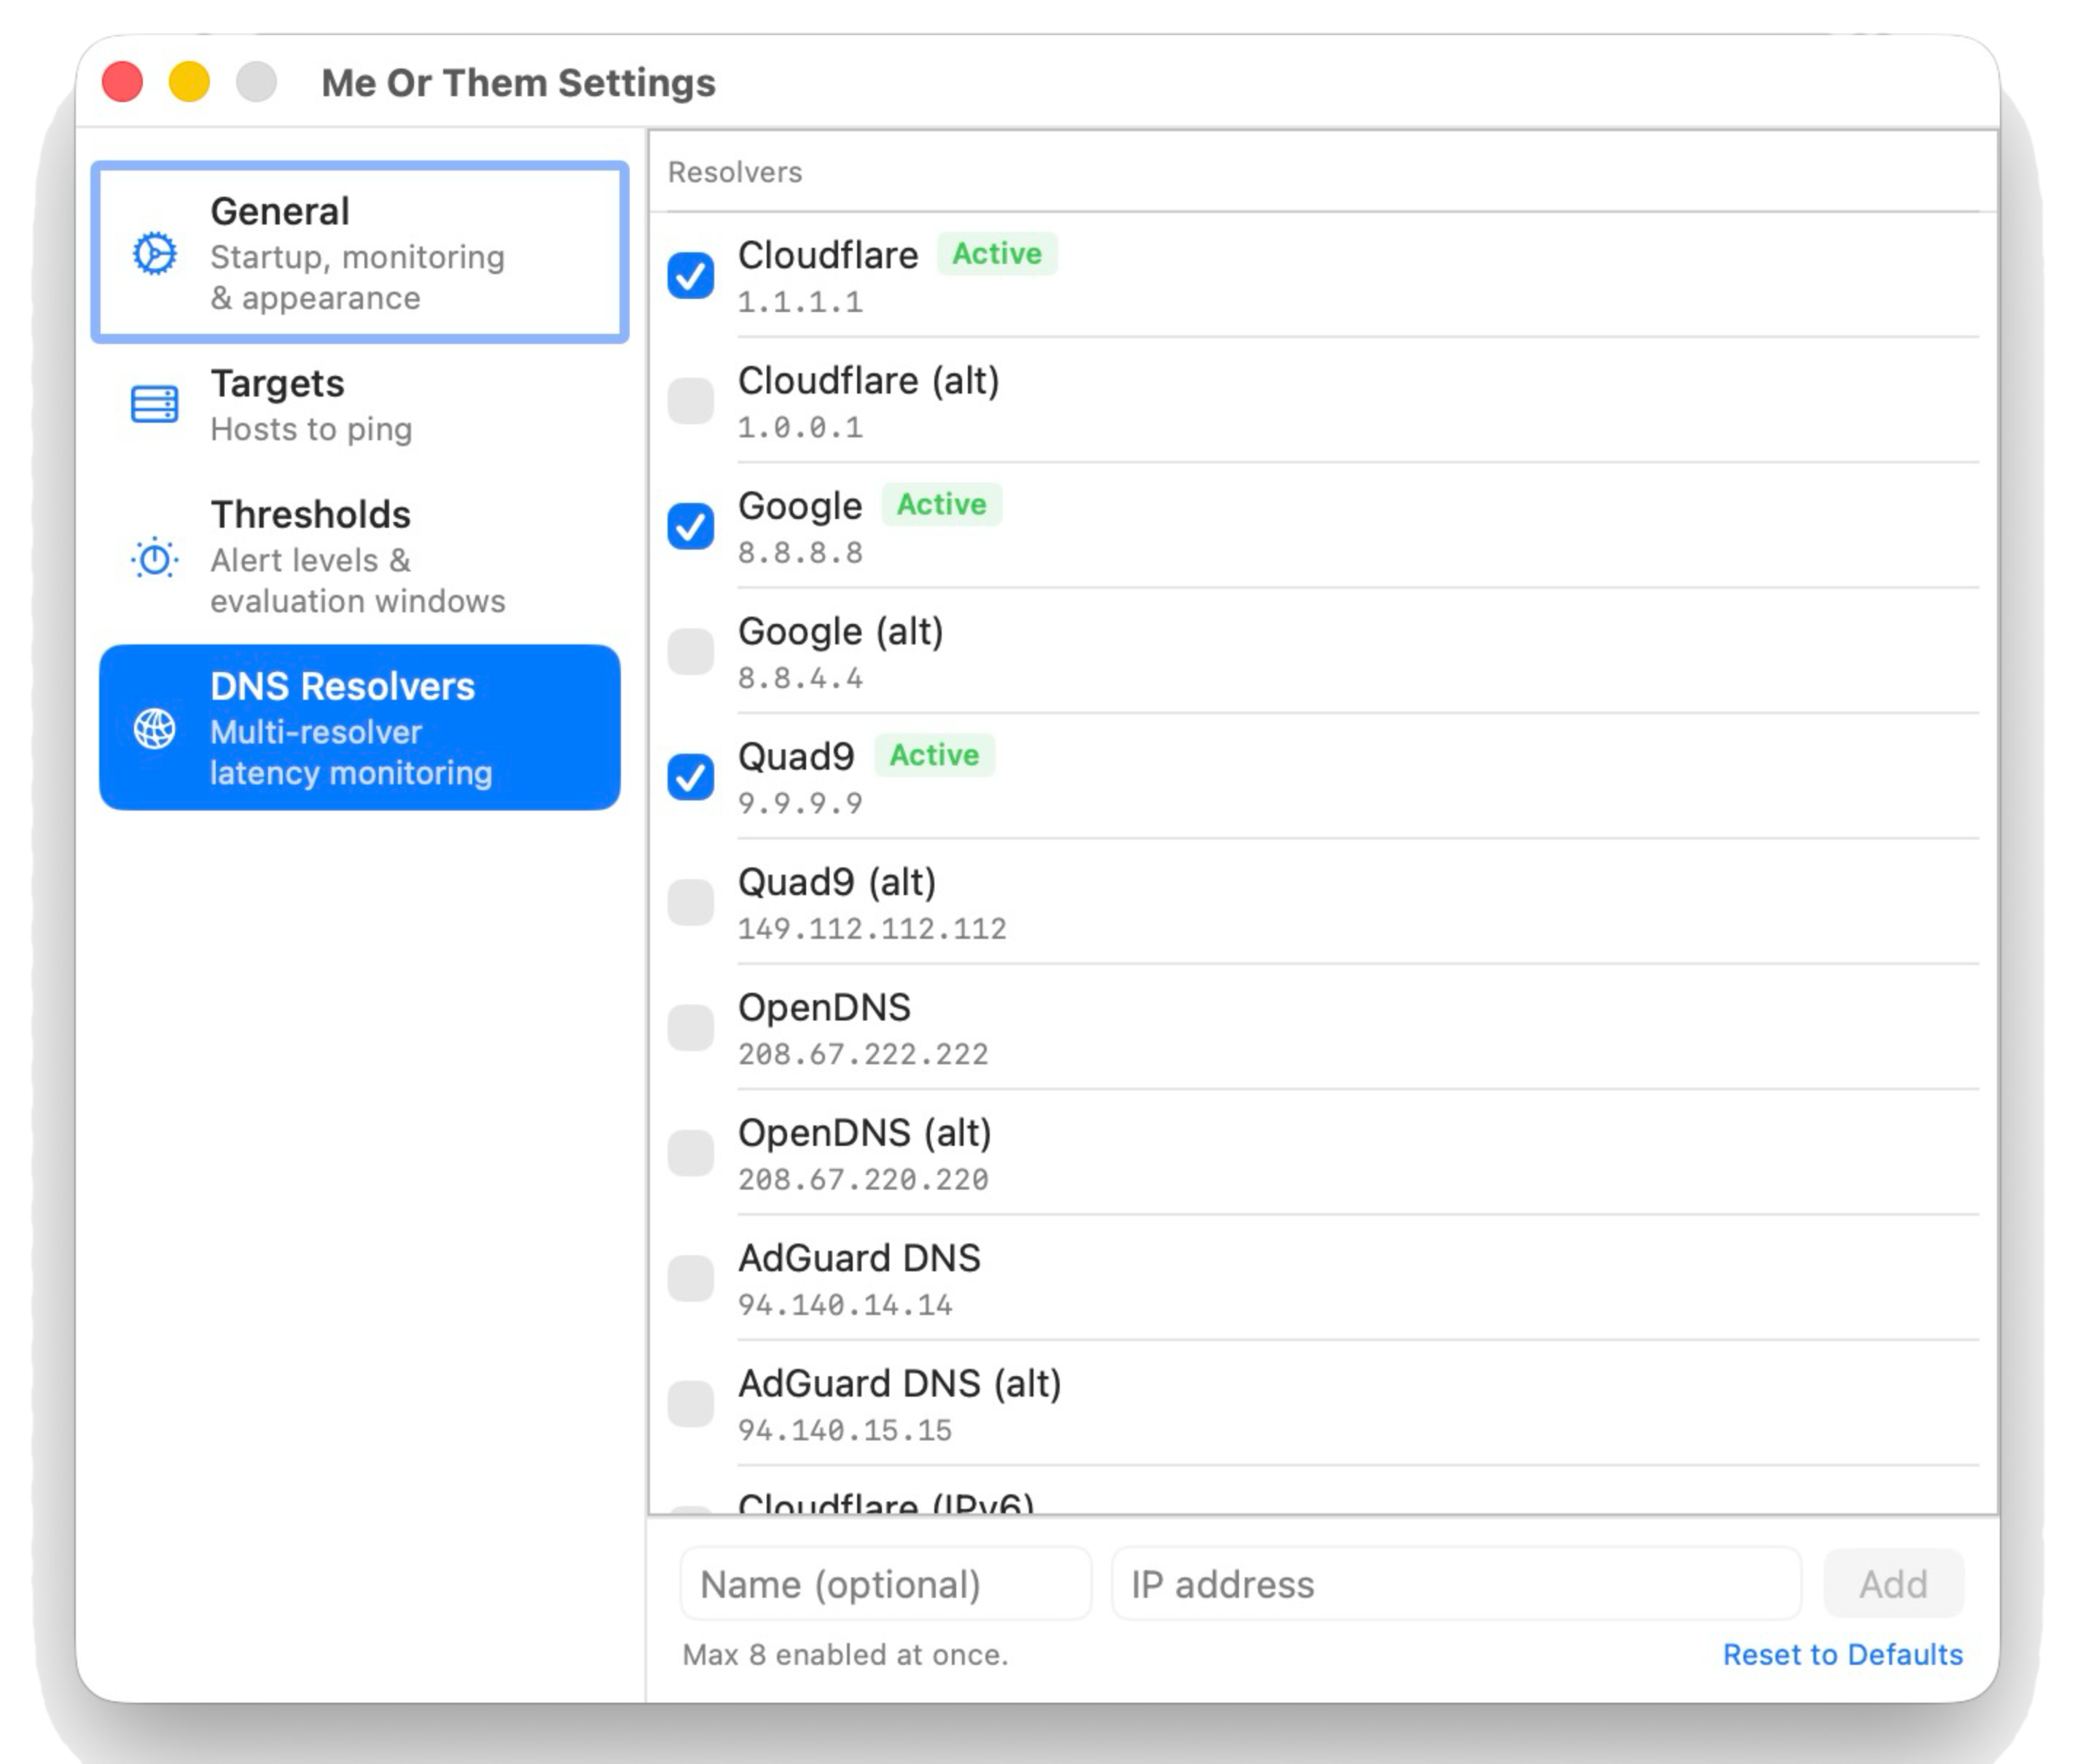
Multi-Resolver DNS Monitoring

Probes up to 8 DNS resolvers simultaneously every ~30 seconds using raw UDP queries that bypass the OS cache — so you get actual resolver response times, not cached values. Cloudflare, Google, Quad9, OpenDNS, AdGuard, and your system and gateway resolvers are pre-configured; add your own in Settings. Slow DNS is one of the most common hidden causes of sluggish browsing, and now it's visible.

Adaptive Polling

When degradation is detected, polling frequency automatically doubles to give you higher-resolution data exactly when you need it. Three consecutive clean polls restore the normal interval. No configuration, no manual reset — it just adapts.

📊

Network History — Up to 366 Days

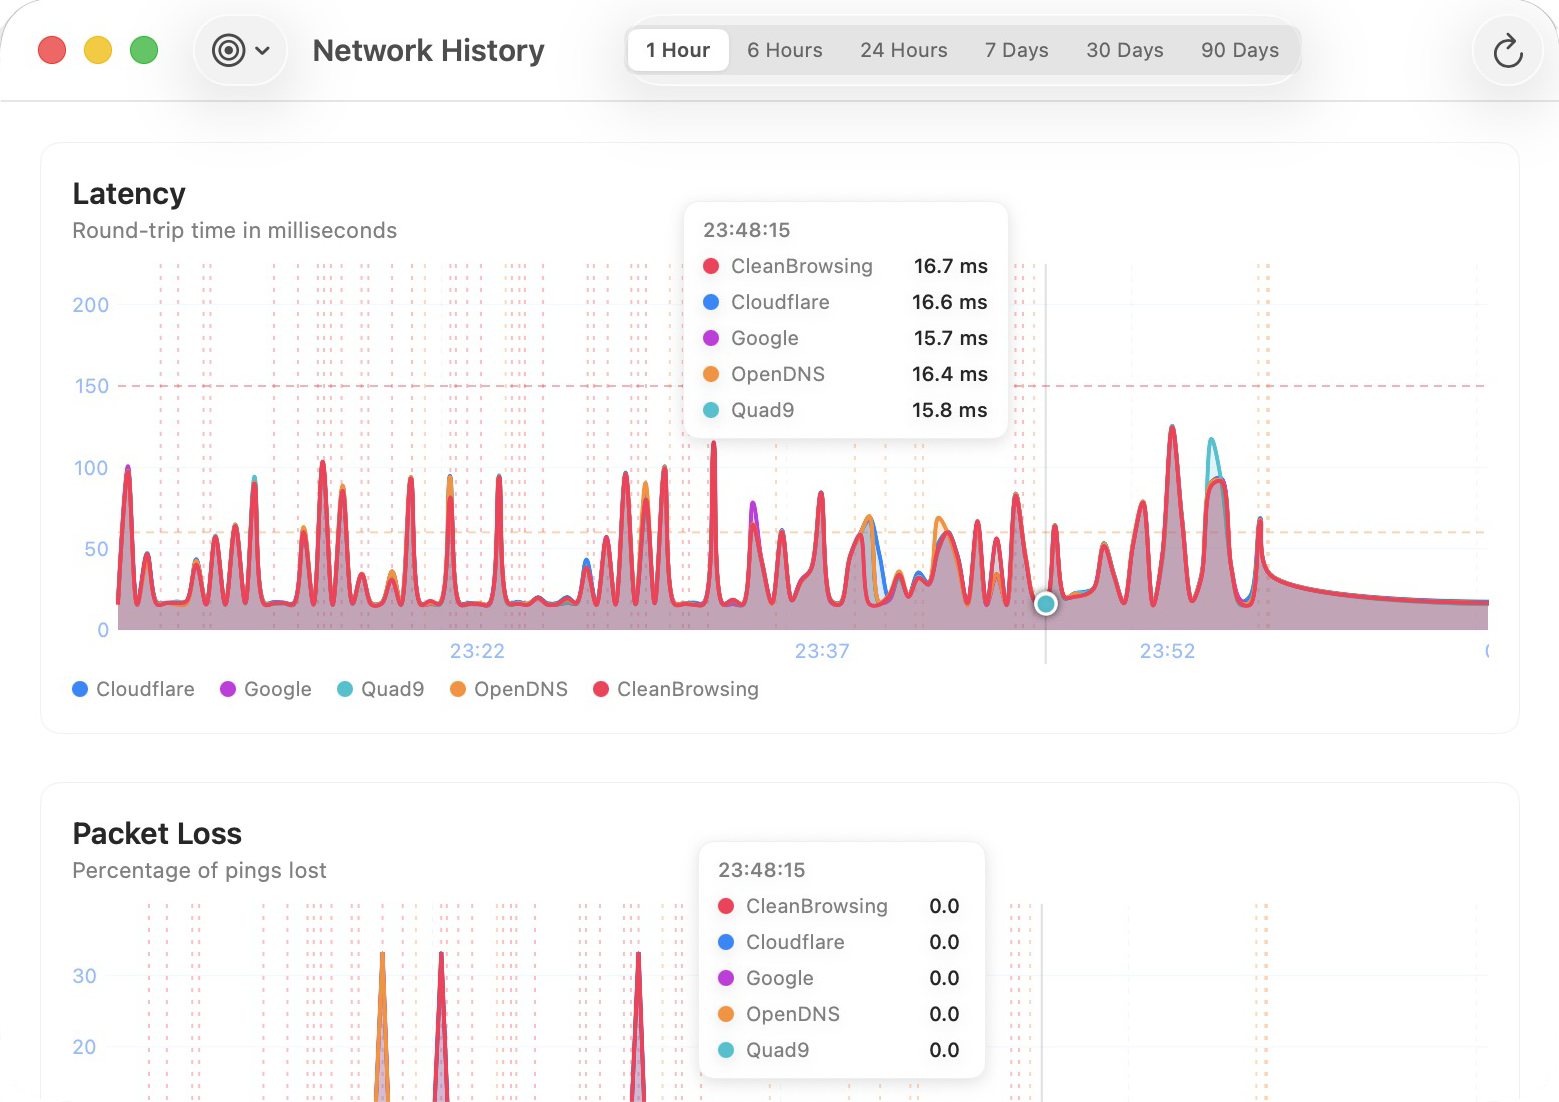
Interactive charts for latency, packet loss, jitter, WiFi signal, and DNS resolver latency. Time windows from 1 hour to 1 year. Incident markers, threshold reference lines, regression trend lines, and a daily pattern chart showing congestion by hour of day across 30 days of history.

🚀

Bandwidth Testing

One-click speed test using the bundled Ookla CLI — no separate download required. A thin colored bar appears below the status icon when results are ready. Results are included in the diagnostics engine's bufferbloat analysis and in all exports.

📄

Full-History Exports

Export gzip-compressed CSV or JSON, or a formatted PDF report — directly from the app. Every export includes timestamps, RTT, loss, jitter, WiFi samples, DNS resolver latency, and target identifiers. Opt in to a continuous daily CSV log at ~/Library/Logs/MeOrThem/ for integration with external tooling.

🔬

MTU & Path Fragmentation

Periodically sends a 1472-byte probe with the Don't-Fragment bit set. A pattern of large-packet failures while normal pings succeed is a classic sign of VPN tunnel misconfiguration, PPPoE DSL link issues, or a firewall silently blocking oversized packets — causing slow loads and stalled connections with no visible ping loss.

⚠️

Hardware Interface Error Monitoring

Samples the kernel's hardware-level error and drop counters for the active network interface every ~30 seconds. Repeated driver drops or CRC errors — invisible to ping — indicate RF interference, a faulty cable, or a failing network adapter. Me Or Them surfaces this before it becomes a full outage.

🔔

Notifications & Auto-Updates

Opt-in macOS notifications fire when your network degrades, even while you're in another app. When a new version is available, a notice appears at the top of the dropdown with a one-click update path. No pop-overs, no nagging, no surprise relaunch.

📈

Menubar Bar Chart Mode

Replace the status circle with a rolling 5-reading bar chart directly in the menubar — so you can see at a glance whether a blip is isolated or part of a trend, without opening a single window.

🏅

Connection Stability Score

Every network session earns a 0–100 stability score with an A–F letter grade, weighted across latency, packet loss, jitter, and DNS reliability. The score surfaces in Connection Profiles for instant comparison across networks, locations, and time periods.

⚙️

Apple Shortcuts Integration

Four Shortcuts actions expose Me Or Them to macOS Shortcuts and compatible automation tools: Get Network Status, Run Bandwidth Test, Get Last Incident, and Export Network Report. Build status-aware automations, trigger diagnostics from a keyboard shortcut, or chain network checks into larger workflows.

🔋

Battery-Aware Monitoring

On MacBooks, monitoring intensity adjusts automatically to power state — Normal on AC power, Reduced on battery, or Pause entirely. Keeps overhead invisible when every milliwatt counts, without any manual toggle.

📤

Local Metrics Endpoint

An optional built-in HTTP server exposes live metrics in Prometheus format and JSON — ready to scrape with Grafana, any OpenMetrics-compatible collector, or custom scripts. Enable it in Settings → Advanced.

⚠ Disabled by default. When enabled, the server listens on 127.0.0.1 (localhost only). Any process running on your Mac can query it. Do not port-forward or expose this to an untrusted network — the endpoint has no authentication.

📖

Built-in Plain-English Help

Every metric, concept, and diagnostic pattern in Me Or Them has a plain-language explanation written for people who aren't network engineers. Open the Help window to read what latency actually means, why jitter breaks calls even when the average looks fine, or what a DNS resolver actually does — written like a patient friend explaining it, not a textbook. No intimidating jargon. No external links. Everything is built in and available offline.
Learn as You Monitor

Built for curious people,
not just network engineers.

Me Or Them surfaces a lot of data. Every number in the app has a plain-English explanation — written for someone who wants to understand what they're looking at, not just know what colour it is.

The built-in Help window is a five-tab reference manual covering every metric, diagnostic pattern, chart feature, and concept in the app. What is jitter, really? Why does 1% packet loss matter so much? What does a DNS resolver actually do? It's all in there — no external links, no jargon, available offline.

📶
Latency

Like shouting and timing the echo. Low is great; consistently >100 ms is a problem.

〰️
Jitter

How consistent your latency is. Wild swings cause choppy calls even when the average looks fine.

📦
Packet Loss

Data that vanishes in transit. Even 1% causes visible lag spikes and stuttering on video calls.

🌐
DNS

The phone book of the internet. Slow DNS makes everything feel slow even when your connection is fast.

Every metric has an explanation like this in the app — and goes much deeper.

Built-in Help window showing plain-English explanations

Network Analysis

Not just red and green.
A verdict, with evidence.

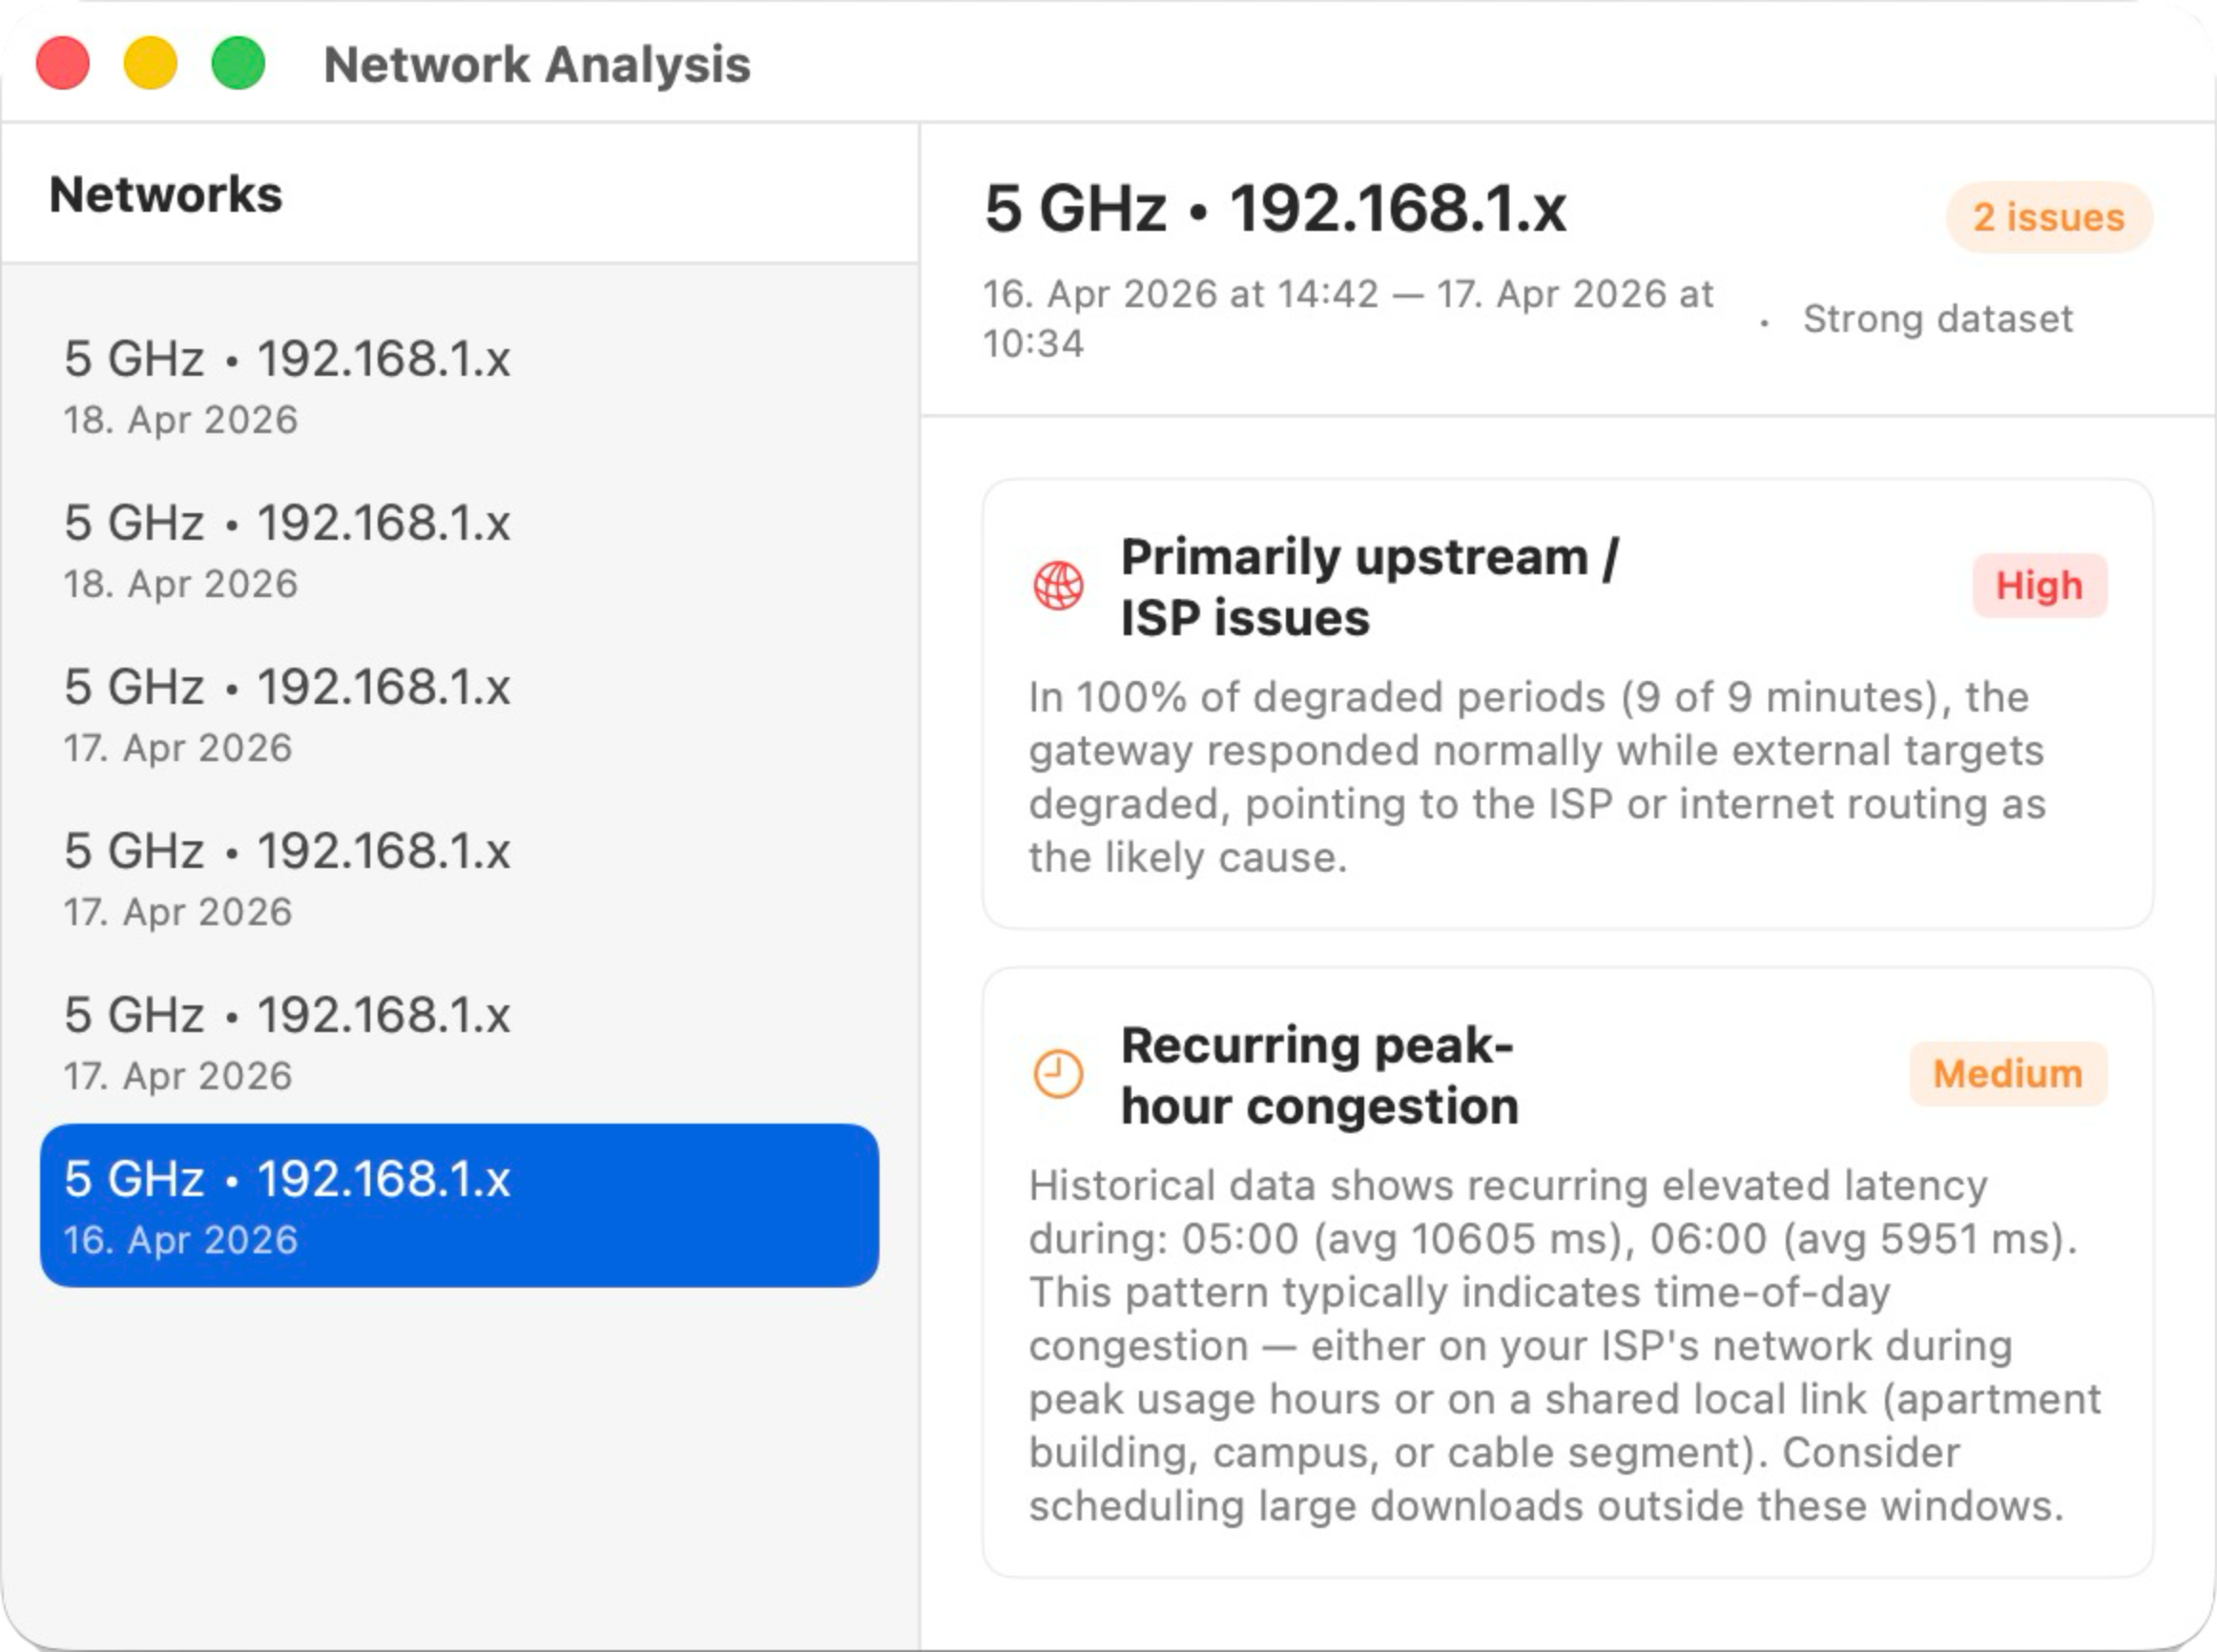
The Network Analysis window reviews every session against 17 diagnostic patterns and tells you what's wrong, why it's wrong, and what to do about it — with a confidence score on every finding.

Elevated latency

Average RTT above threshold, with gateway attribution (local vs. ISP) and peak-hour breakdown.

Packet loss — burst vs. steady

Distinguishes sustained burst loss from sporadic drops. Gateway attribution pinpoints the fault side.

Jitter — congestion vs. instability

Inter-poll variance separates congestion patterns from severe connection instability.

Weak or unstable WiFi signal

Flags poor average RSSI and high signal variance independently. SNR modulates confidence.

Session fault profile — local vs. ISP

Minute-by-minute classification of degraded periods to produce a clear verdict across the session.

WiFi / latency Pearson correlation

When signal drops map statistically to latency spikes, WiFi is confirmed as the root cause.

Per-target outlier detection

A target showing 2.5× the average latency of others likely reflects a routing or CDN issue — not your connection.

Bufferbloat

Compares idle RTT baseline against latency-under-load from speed tests. Recommends SQM/FQ-CoDel when confirmed.

DNS multi-resolver analysis (5 patterns)

High failure rate, elevated latency, resolver divergence, complete DNS failure, and UDP port 53 blocking — each as a separate finding.

Hardware interface errors

Repeated kernel-level drop deltas suggest RF interference, a faulty cable, or a failing adapter.

MTU / path fragmentation

Large-packet probe failures alongside successful normal pings confirm a fragmentation issue on the path.

Latency trend (OLS regression)

Linear regression on the RTT sequence detects slow upward drift — thermal throttling, buffer saturation, or background congestion.

WiFi channel switching

Repeated channel changes suggest RF interference forcing the AP to self-heal. Band switches (2.4↔5 GHz) are called out separately.

Time-of-day congestion (cross-session)

Compares this session against 30 days of aggregate history to detect recurring peak-hour slowdowns consistent with ISP contention.

Automatic traceroute snapshots

When the connection drops from green to red, a traceroute runs automatically in the background. The hop-by-hop output is surfaced in the analysis window with the highest-latency hop highlighted.

Confidence scoring

Every finding is rated by a data-sufficiency multiplier — insufficient, limited, adequate, or strong — based on sample count. Findings below 40% confidence are silently suppressed. You only see what the data actually supports.

High Medium Low

Per-network sessions

Me Or Them automatically fingerprints each network environment (gateway IP + WiFi band + channel + subnet) — no location permission required. Every sample is tagged to its session so the analyser draws accurate per-network conclusions across your history.

Expandable evidence

Each finding shows a plain-English description with specific numbers. Traceroute findings include a full expandable hop-by-hop output, selectable for copying into a support ticket or further analysis.

Network Analysis window showing findings with confidence badges

Network Analysis — findings sorted by confidence, with category icons and plain-English detail.

Performance

Obsessively light.

Every byte of memory and every CPU cycle was treated as a resource worth fighting for. Running seventeen diagnostic loops around the clock has a cost — Me Or Them keeps that cost invisible.

0.4%
CPU usage
Sustained average during active monitoring at the default 2s interval
14MB
Memory footprint
Stable under continuous 24/7 monitoring with full history enabled
483
Tests passing
Every release must pass the full suite — no exceptions
366d
History retained
Per-minute aggregates for a full year; raw data kept for 7 days
0px
Dock presence
Lives entirely in the menubar — never touches your Dock

How It Works

Smarter than a single ping.

Me Or Them uses per-metric evaluation windows, adaptive polling, gateway fault isolation, and raw UDP DNS probing to give you signal — not noise.

🔄

Evaluation Windows — No False Alarms

Each metric is averaged over its own configurable window (default: 15 s latency / 10 s loss / 30 s jitter) before comparing against thresholds. A single noisy poll is diluted by the surrounding good samples and never triggers a status change alone. The 30-second jitter window specifically guards against Apple's AWDL-service channel scans (AirDrop / Handoff) that spike every ~60 seconds.

🗺️

Fault Isolation — Exactly Where to Look

Every tick includes a gateway ping alongside your external targets. If your router is unreachable: "local network / router". If the gateway is fine but external targets all fail: "ISP / internet outage". The gateway appears as a permanent entry in the menu with its own sparkline and live latency reading.

🌐

Raw UDP DNS Probing

DNS probes are sent as raw UDP packets directly to each resolver, bypassing mDNSResponder and the OS cache entirely. What you see in the dropdown is the resolver's own response time — accurate, uncached, and comparable between providers. When one resolver is consistently slower than the others, you'll know.

Adaptive Polling — More Data When It Matters

After two consecutive degraded polls, the polling interval halves automatically. Denser data exactly when you need to diagnose a problem. After three clean polls the original interval is quietly restored — no configuration, no manual reset.

📊

Trimmed Outlier Rejection

With three or more targets, the best and worst readings per metric are discarded before computing overall status. A consistently slow server or a temporarily unreachable target can't drag your status to red on its own. Status reflects your actual experience across all targets.

⏸️

Pause & Resume

Pause monitoring when you're offline intentionally — travelling, hotspot, VPN — so you don't accumulate false degradation events or skew the session history. The icon shifts to grey. Bandwidth testing is also suppressed while paused.

Why Me Or Them

What I Did To Get This Right

Every design decision came from a specific failure mode in the alternatives.

✓ Me Or Them

Single-poll spikes are ignored

Status only changes when the rolling average of a metric — over its own configurable window — crosses your threshold. One bad packet doesn't flip the icon. Neither does AWDL. Neither does a brief routing hiccup during a background sync.

✓ Me Or Them

No Location permission required

Full WiFi diagnostics — RSSI, SNR, channel, BSSID, PHY mode — obtained via CoreWLAN without ever requesting Location access. Your privacy settings stay exactly where you set them.

✓ Me Or Them

Fault isolation is built in from day one

A gateway ping runs every single tick. The app tells you whether a problem is on your side or upstream — not just that something is wrong. Most monitors don't distinguish the two at all.

✓ Me Or Them

DNS is a first-class metric

Most network monitors ignore DNS entirely. Me Or Them probes eight resolvers independently using raw UDP packets, surfaces slow resolution and failures in the dropdown, and runs five DNS-specific diagnostic patterns in the analysis engine.

✓ Me Or Them

Genuinely invisible to your system

0.4-1% CPU. 14-30 MB memory. Zero Dock presence. Event-driven I/O throughout — no threads blocked on subprocess output. This is a network diagnostics platform that costs less than the font rendering for this sentence.

✓ Me Or Them

A full year of history, completely local

Raw data for 7 days, per-minute aggregates for 366 days, incidents for a year — all in a local SQLite file you own outright. No account, no cloud sync, no subscription. Export to CSV, JSON, or PDF whenever you like.

✓ Me Or Them

Open source and auditable

Every line of code is on GitHub. No telemetry. No analytics. No network calls you didn't initiate. The binary is signed and notarized by Apple. The source includes a complete build pipeline so you can inspect, compile, and sign it yourself.

✓ Me Or Them

Diagnoses problems, not just reports them

When something goes wrong, Network Analysis doesn't just show you a red number. It runs 17 evidence-based patterns, correlates signals across dimensions, and produces a plain-English finding with a confidence score and a recommendation — the difference between "your latency is high" and "your WiFi signal instability is causing this, and here's the correlation to prove it."

Security

You can trust what you can't see.

Me Or Them was audited end-to-end for the OWASP top 10 and beyond. Every line that touches external data or spawns a subprocess was written with a paranoid eye.

  • No Shell Injection

    All subprocess calls use argument arrays — never string interpolation. Shell metacharacters in hostnames or IP addresses can't reach your system.

  • Input Validation via inet_pton

    IP addresses are validated with inet_pton; hostnames pass a strict shell-character whitelist before any process is spawned.

  • Binary Integrity Verification

    The bundled speedtest CLI is verified against a known signature before execution. A tampered or substituted binary is rejected outright — not silently run.

  • No Location Permissions

    Full WiFi details — channel, BSSID, SNR, PHY mode — obtained via CoreWLAN APIs without requesting Location access at any point, on any version of macOS.

  • No Telemetry. No Analytics. No Cloud.

    Me Or Them makes no network calls you didn't initiate. No usage data is collected. No crash reports are sent anywhere. The only outbound traffic is the pings and DNS probes you configured.

  • Open Source & Notarized by Apple

    Every line of code is publicly available on GitHub. The binary is signed with a Developer ID and notarized by Apple — Gatekeeper verifies it on every launch.

  • Local Metrics Server — Localhost Only, No Auth

    The optional Prometheus/JSON metrics endpoint is disabled by default. When enabled, it binds to 127.0.0.1 only — but any process on your Mac can query it without credentials. Do not port-forward or proxy this endpoint to an untrusted network. Treat the exposed metrics as sensitive: they include your configured target hostnames, resolver IPs, and network fingerprints.

Built-in Plain English Help

What does it all mean?

Every metric has a built-in explanation written for humans. Open Help from the menu for the full guide.

📶
Latency

Like shouting and timing the echo. Low is great; consistently >100ms is a problem.

〰️
Jitter

How consistent the latency is. Wild swings cause choppy calls even when the average looks fine.

📦
Packet Loss

Data that vanishes in transit. Even 1% causes visible glitches on calls and lag spikes in games.

🌐
DNS

The phone book of the internet. Slow DNS makes everything feel slow even when your connection is fast.

Christian Nilsson, creator of Me Or Them

The Story

Why "Me or Them"?

I work remotely — and like anyone whose living depends on a stable connection, I kept asking the same question: is this my network, or is it the service I'm trying to reach? The apps that existed were too heavy, too expensive, too complicated, or required permissions I wasn't comfortable granting.

So I built something simple: a circle in the menubar. Green means everything is fine. That was v1. It worked beautifully and cost almost nothing to run.

But "something is wrong" is only half the answer. The other half is why. So v2 became something else entirely — a network intelligence platform that runs 17 diagnostic algorithms around the clock, probes DNS resolvers with raw UDP packets, detects MTU fragmentation, correlates WiFi signal with latency using Pearson statistics, and auto-captures traceroutes when the connection drops.
All with a footprint of 0.4-1% CPU and 14-30 MB of memory (because I love obsessing over small details).

Open source because tools that help people should be transparent, free, and auditable by anyone. Signed and notarized because your Mac deserves to know it can trust what it's running.

Christian Nilsson

In Action

Every detail, at every level.

From a glance at the menubar to a year of network forensics — it's all there.

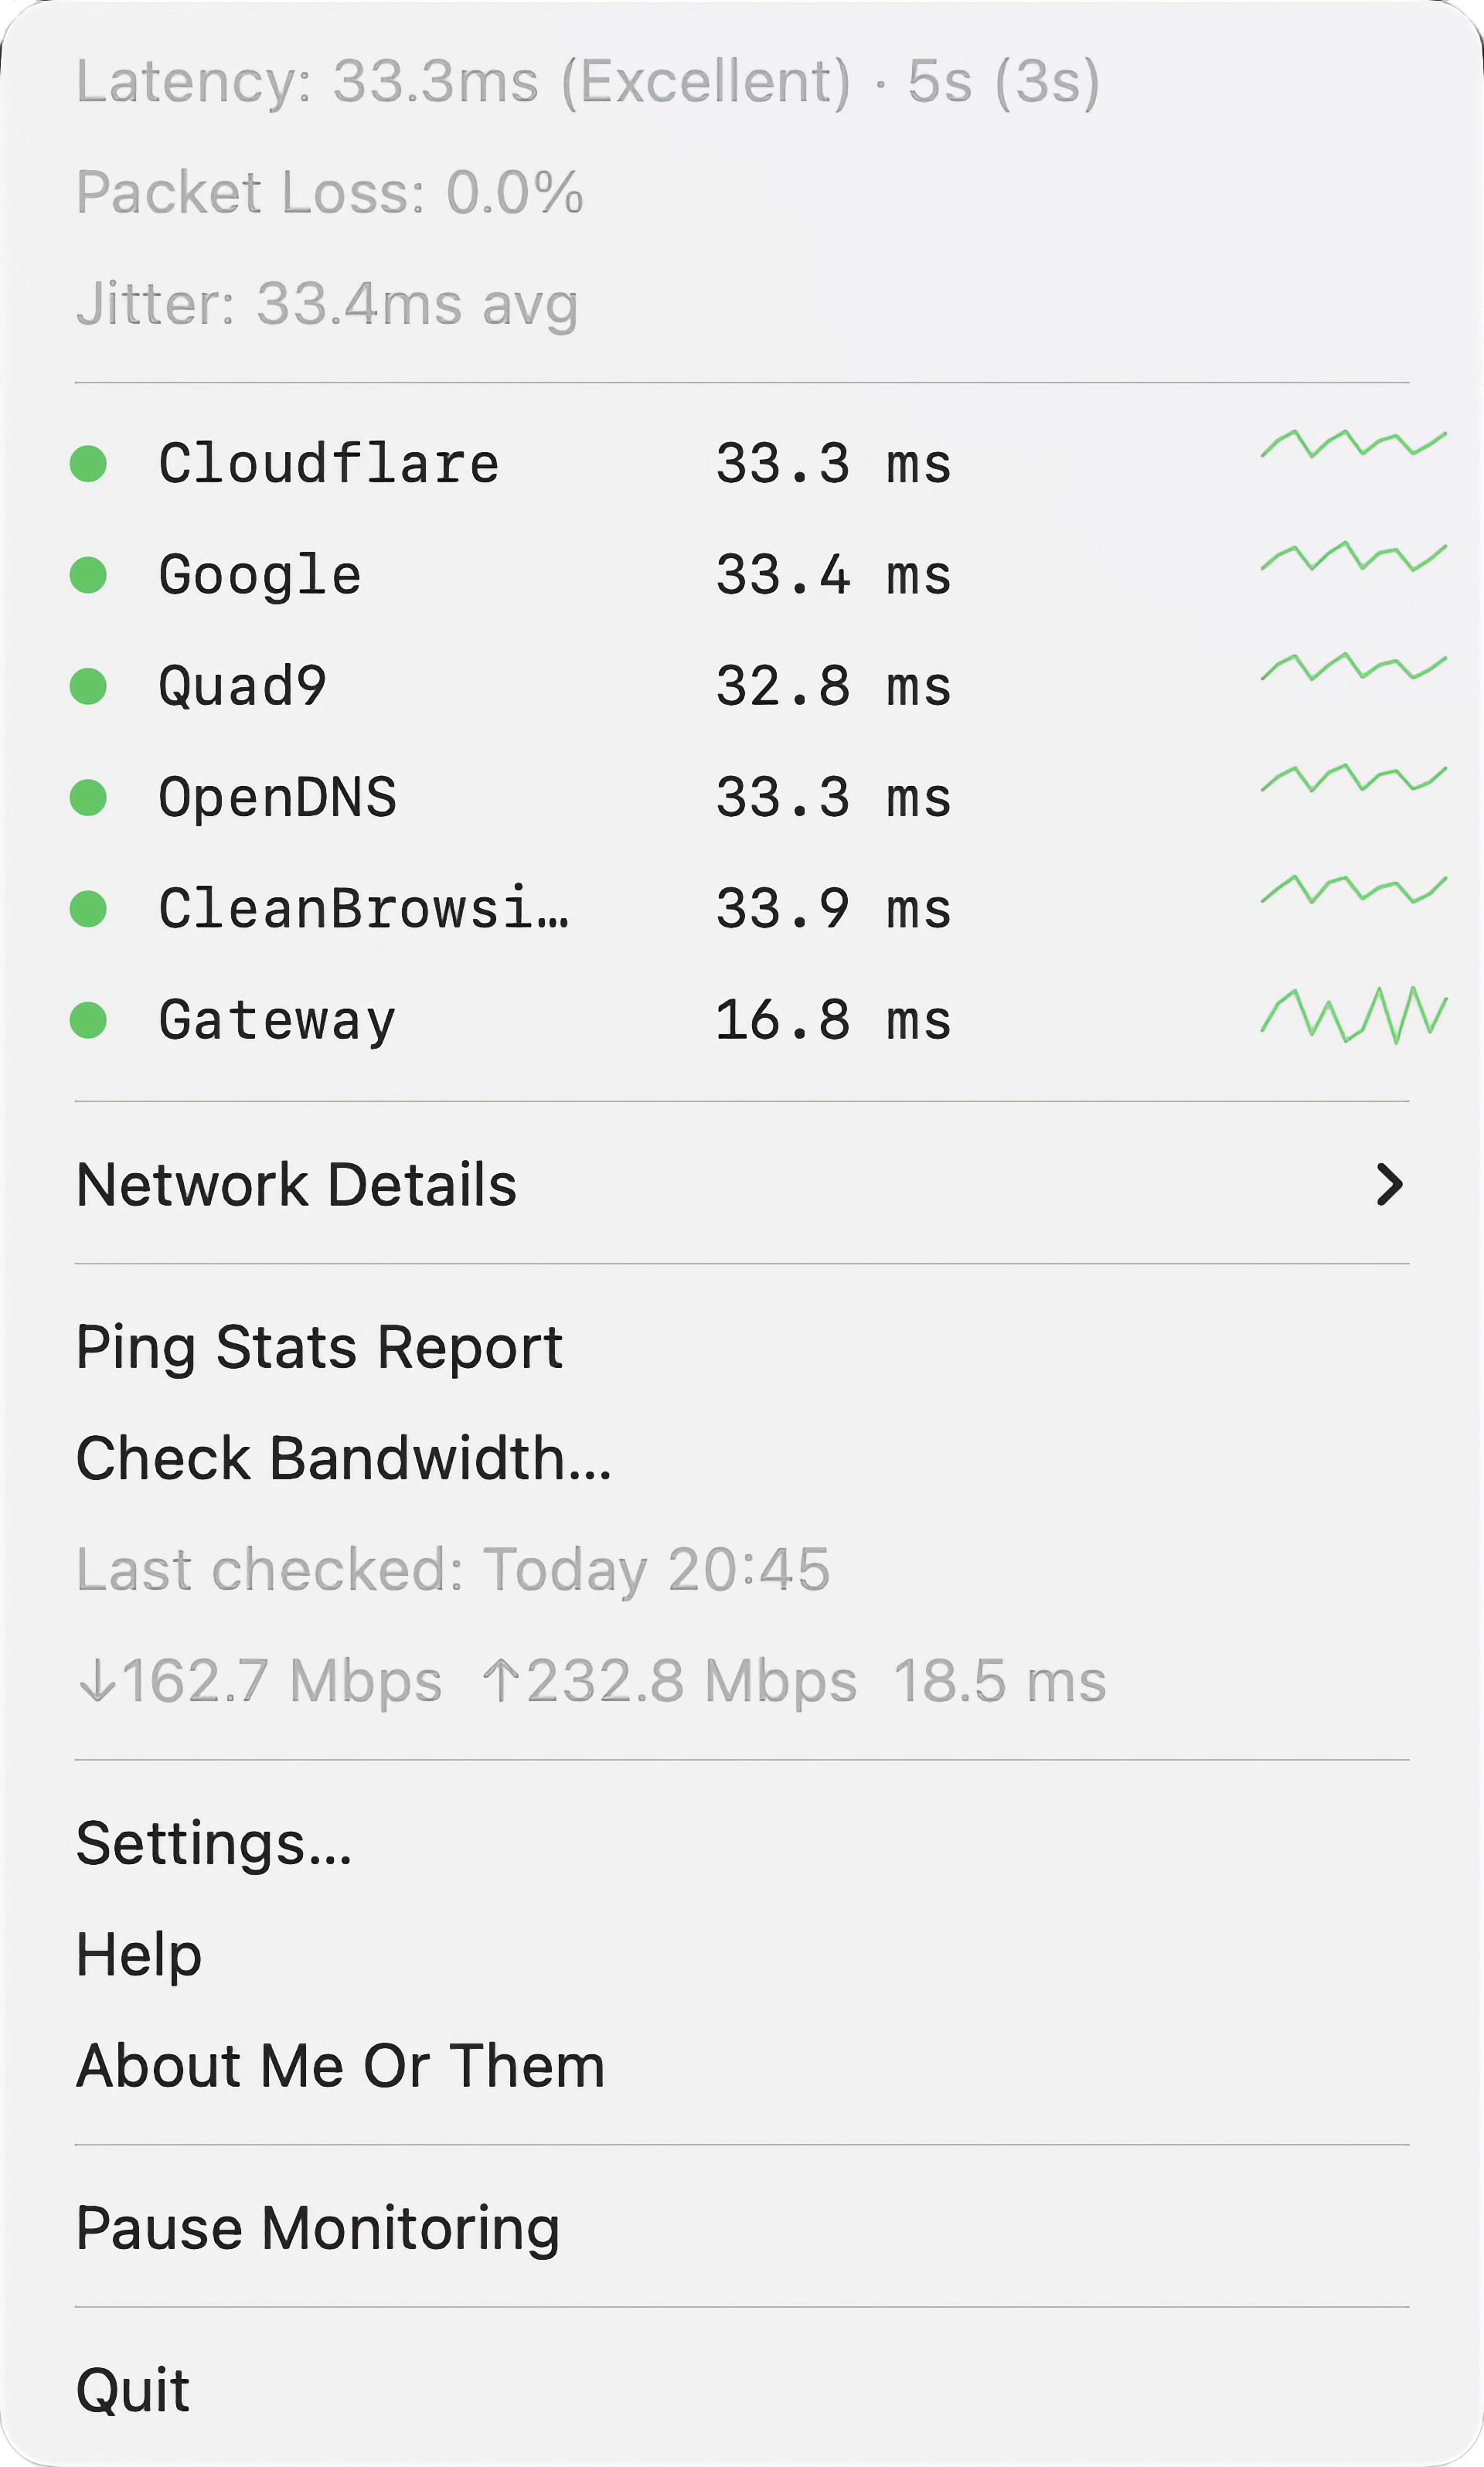
Me Or Them dropdown menu with latency, loss, jitter and DNS readings

Live Network Dashboard

Latency, packet loss, jitter, DNS response time, gateway status, and WiFi signal — all in one glance. Every metric colour-coded and updated every two seconds.

Network Analysis window showing confidence-scored diagnostic findings

Network Analysis

17 diagnostic patterns reviewed against your session history. Plain-English findings sorted by confidence — from bufferbloat and MTU fragmentation to WiFi correlation and time-of-day congestion.

Built-in advanced analytics engine with a comprehensive and educational help section to explain the what, the why and the how

Built-in Plain-English Help

A full reference manual built directly into the app — five tabs covering every metric, every diagnostic pattern, and every chart feature. Written in plain English, explained like a patient friend, not a textbook. Understand what you're looking at while you're looking at it.

Network History charts with trend line and daily pattern chart

Network History & Trends

Interactive charts from 1 hour to 1 year, with a regression trend line, incident markers, and a daily pattern chart showing congestion by hour of day.

WiFi details showing RSSI, SNR, channel, BSSID and PHY mode

Deep WiFi Diagnostics

BSSID, RSSI, SNR, channel, band, PHY mode, and Tx rate — sourced directly from CoreWLAN, without requesting Location access.

DNS Resolvers settings tab showing configured resolvers and their status

DNS Resolver Settings

Enable, disable, or add custom resolvers. Up to 8 active simultaneously — Cloudflare, Google, Quad9, OpenDNS, AdGuard, and your own.

Download

Free. Open source.
Yours to keep.

Download the ready-to-run .dmg, or clone the source and build it yourself. The repository includes a complete automated build pipeline — sign it yourself or use your own Apple Developer ID. Either way, completely free, forever.

No account No subscription No telemetry No cloud Apple signed & notarized

macOS 14 Sonoma or later required  ·  Apple Silicon & Intel supported
Signed and notarized by Apple  ·  Source available on GitHub for audit, learning, and self-build